Software OVHWizard
Software of the OVHWizard
The OVHWizard software serves for:
- Parameterisation of the measuring system
- Measured data recording, saving and evaluation
- Graphic online display of the measured values
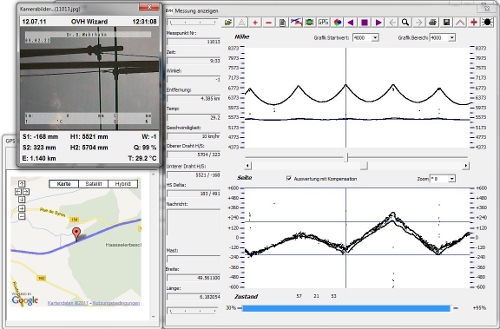
- Online display of the camera images of the contact wire
- Transfer of the measured data to customer-specific software
- Transfer of the data to the FMA software
- Data processing in the postprocessing
All vehicle parameters such as wheel diameter, distance pulses per wheel revolution or assembly height of the OVHWizard above the top edge of the rail are entered and saved with the Vehicle Set-up. With these parameters, the position of the measurement system in relation to the rail is determined after mounting or calibrated automatically before a measurement run.
The distance travelled is measured by a light barrier and reflectors mounted on the wheel or by reading in the vehicle-internal pulses.
The measurement is displayed graphically to the operator online during the measurement. The height and stagger of the contact wire and the catenary wire - providing this is in the set measuring range of the system - are displayed together with the set tolerance limits. The camera image with the measured values is displayed additionally as an option.
Ten events (e.g. points, crossing, bridge, etc.) can be programmed with the computer function keys and can be set during the run. The software offers the possibility of viewing the measurement again after the measurement.
The analysis function offers the possibility of evaluating the measurement automatically. Pole positions are detected here automatically. The height and stagger of the contact wire are shown as measured values at these poles and in the centre of the span length step. The gradient and the span length step are also determined and specified.
At the end of the analysis it is possible to create a report or to export the data to Excel.
FMA Evaluation Software
The FMA software was developed by SIEMENS for post-evaluation of height and stagger measurements. We then developed it further to offer the OVHWizard system user the following possibilities by direct interaction with the OVHWizard software:
- Checking the specified basic data of the line
- Combining the measured data with existing measured basic data of the measuring line
- Synchronisation of the measured data with existing line data
- Automatic determination of pole and dropper positions
- Determination of the tolerances for the measurement by design types from the railway regulations (e.g. Re 160, Re 200, Sicat etc.)
- Monitoring of the permissible wind deflection
- Monitoring of the span length steps and the gradients
- Creation of a report according to railway specifications
- Comparison of the measurements with and without uplift and determination of elasticity
- Creation of a list of necessary corrections with values for the correction
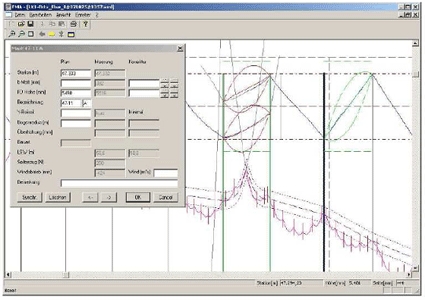
After recording a measurement with the OVHWizard software, the FMA software is started with it and the measurement file is read in. The project data such as line designation, track, measured section, type of contact line, rated contact wire height, wind velocity and data for the later output format for this measurement file are then loaded. Then the previously tested basic data for track and contact line are loaded. The basic data can be viewed together with the measured data in a preview. Then the basic data and measured data are shifted manually over each other at significant points at the beginning and end of the measurement and then synchronised automatically. This eliminates any differences in the distance measurement by measuring wheel slip or inaccurate specification of the wheel diameter.
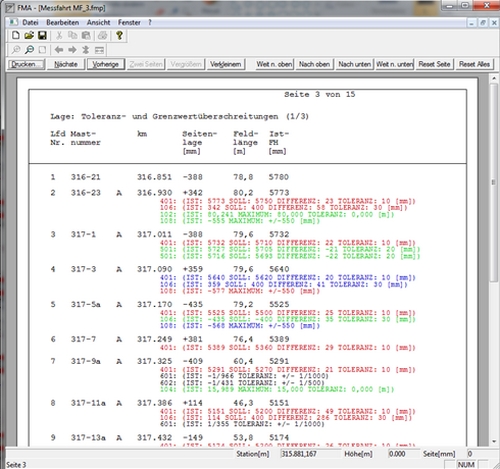
The software then automatically determines the deviations from the specifications at the pole and dropper locations and writes this deviation as an error code in different colours to the pole locations or the span length step according to whether a warning or tolerance value is exceeded.
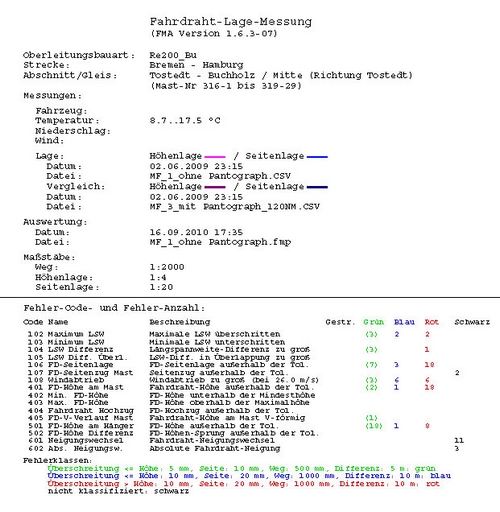
The determined values can be printed together with the graphic display of the measured values and the tolerance band in table form as a report. The cover sheet of the report contains the general information about the line data of the measurement and the temperature during the measurement and an overview list of all the errors occurring in the measured section separated according to error code. Then all measured values are listed separately in a table according to pole and dropper positions.